Christian Augsten, Karsten Mäder
Flow Field-Flow Fractionation (Flow-FFF) is a powerful tool to separate molecules and particles in a range from 103 to 107Da and particles of nanometric size up to a few micrometers [1]. By coupling FFF to Multi-angle light scattering (MALS) it is possible to determine absolute molar masses (M) of molecules and to verify their aggregation. For macromolecules of an appropriate size the radius of gyration (rg) can be achieved [2]. The aim of our study was to investigate various chitosan types by applying Flow-FFF and MALS to their aqueous solutions.
Christian Augsten1, Karsten Mäder1
1Institute of Pharmaceutics and Biopharmaceutics, Wolfgang-Langenbeck-Str. 4, D-06120 Halle/Saale
Martin-Luther-University Halle-Wittenberg, Germany
Introduction
Flow Field-Flow Fractionation (Flow-FFF) is a powerful tool to separate molecules and particles in a range from 103 to 107Da and particles of nanometric size up to a few micrometers [1]. By coupling FFF to Multi-angle light scattering (MALS) it is possible to determine absolute molar masses (M) of molecules and to verify their aggregation. For macromolecules of an appropriate size the radius of gyration (rg) can be achieved [2].
The aim of our study was to investigate various chitosan types by applying Flow-FFF and MALS to their aqueous solutions. In pharmaceutics chitosan is used as a new excipient in tablets and pellets or as a drug carrier in micro- and nanoparticles [3]. It is mucoadhesive and applied in wound dressing. Furthermore it achieved increasing importance because of its DNA complexation potential. Chitosan is a polyaminosaccharide that is produced from Chitin what is widespread in exoskeletons of vaious arthropoda. Thus the quality of the products and its chemical modified derivates strongly depends on its natural sources. In most cases, only viscosity values in strongly acidic solutions are provided in product sheets, which is insufficient to describe the polydispersity of the molar mass. We decided to separate different chitosan types with Flow-FFF and examined them in detail using MALS
Experimental Methods
We used 0.2% (w/v) chitosan solutions in acetate buffer of pH 4.2 containing 0.02% (w/v) sodium azide to prevent bacterial growth. Chitosan types were 90/100/A1 and 90/1000/A1 from Medical Chitosan. The solutions were separated within 24min with a constant detector flow rate of 1ml/min and a two step cross flow rate gradient from 2ml/min to 0ml/min. An asymmetrical Flow-FFF (channel and Eclipse F from Wyatt Technology Europe), a MALS detector (DAWN EOS, Wyatt Technology Europe) and a refractive index (RI) detector (Shodex RI-101) were used. The channel height was 350µm, the membrane consisted of a 10kDa cut off regenerated cellulose membrane and the Debye equation was used for data evaluation [2].
Results and Discussion
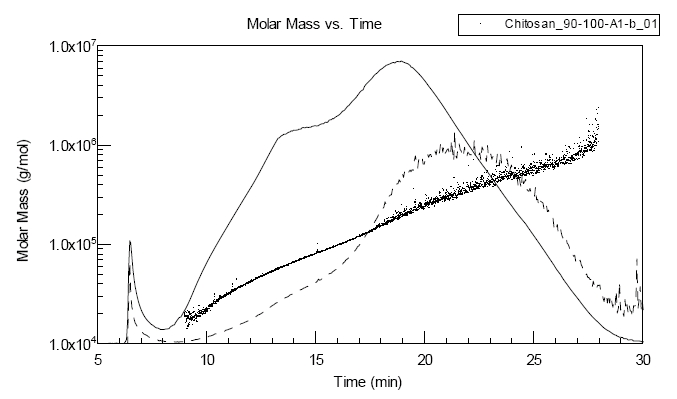
Flow-FFF/MALS/RI provided concentration, scattering intensities and molar masses for each of the probe slices eluting from the channel what can be seen in the fractograms in figures 1 and 2. According to FFF theory, molecules of higher hydrodynamic radii eluted later from the channel. Thus, the concentration main peak at approximately 26min for 90/1000/A1 already indicated higher average molar masses than 90/100/A1.
Figure 1: Example fractogram of 90/100/A1, straight line peak represents concentration, segmented line peak intensity at 90° angle and dots molar masses
Figure 2: Example fractogram of 90/1000/A1, straight line peak represents concentration, segmented line peak intensity at 90° angle and dots molar masses
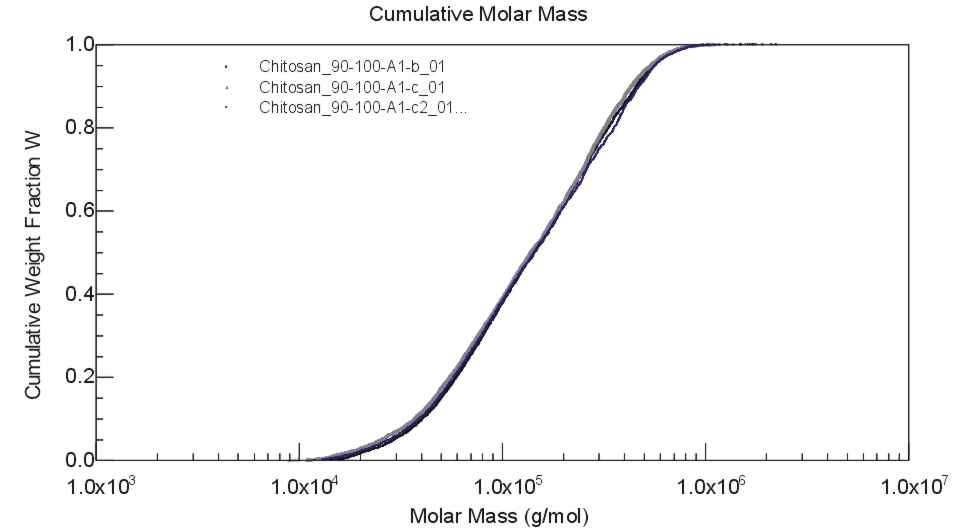
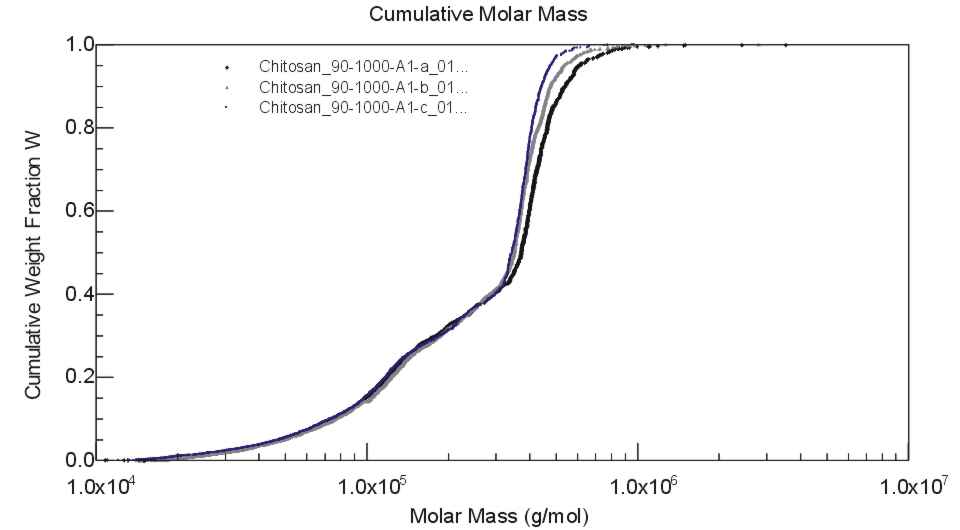
For both samples, the scattering intensity peak was slightly shifted to higher elution volumes. That was attributed to the higher sensitivity of scattering detectors for bigger particles or molecules. At the end of separation another intensity peak appeared (here not shown) that was not provided by the RI measurements, indicating the presence of aggregates. These aggregates were already described before by several authors as e.g. [4], making a separation procedure prior to characterization necessary. To achieve information about molar mass distribution, molar mass sum plots were calculated as given in figure 3 and 4.


Figure 3: Sum plots of molar masses of 90/100/A1 Figure 4: Sum plots of molar masses of 90/1000/A1
It can be seen that 90/100/A1 was following a monomodal distribution while 90/1000/A1 resulted in a more complex multistage sum plot. From the data average molar masses of weight and number could be calculated that are given in table 1. The middle parameter of type description represented the chitosan viscosity in 1% (w/w) acetic acid given by the producer. What was not estimated from the viscosity relationship of both types, the differences in Mw of approximately 2039kDa versus 30914kDa were relatively small. The corresponding PDI values were 2.30.1 and 1.90.1, indicating a wider molar mass distribution for 90/100/A1. These values were not expected due to the sum plots where 90/1000/A1 resulted in a more complex molar mass distribution. Thus the PDI values were no sufficient criteria to describe complete the differences in molar mass distributions. The high recovery rates assured that nearly the entire samples were used for characterization and the amount of substance lost through the pores of or adsorbed at the 10kDa membrane was not relevant.
|
Chitosan |
Mw [kDa] |
Mn [kDa] |
PDI |
RR[%] |
|
90/100/A1 |
206±5 |
93±2 |
2.2±0.1 |
95 |
|
193±5 |
83±2 |
2.3±0.1 |
101 |
|
|
210±5 |
90±3 |
2.3±0.1 |
97 |
|
|
90/1000/A1 |
331±17 |
164±5 |
2.0±0.1 |
91 |
|
305±15 |
166±5 |
1.8±0.1 |
92 |
|
|
293±9 |
159±5 |
1.8±0.1 |
93 |
Table 1: Apparent weight (Mw) and number (Mn) average molar masses, polydispersities (PDI=Mw/Mn) and corresponding recovery rates (RR) of both chitosans
Conclusion: Two chitosans were successfully characterized using aFlow-FFF/MALS/RI. The elution behavior was found to be molar mass dependent. The combination with MALS/RI allowed the calculation of absolute molar masses. Due to the prior separation, the method permitted the detection of chitosan aggregates at elution times higher than other sample contents. Thus, in contrast to GPC or batch-MALS, they were not filtered out or disturbed scattering data evaluation of other sample components. As a further advantage, molar mass distributions were received that gave further information in addition to PDI values.
Thus, Flow-FFF/MALS is an ideal tool to characterize chitosans in detail. It can help to develop samples with predictable average molar masses and narrow distributions what is still difficult today. Especially pharmaceutical products and semi-synthetic derivates should benefit from predictable product properties.
References
|
[1] |
J.C. Giddings, Science 260, 1456-1465 (1993). |
|
[2] |
P.J. Wyatt, J. Coll. Int. Sci. 197, 9-20 (1998) |
|
[3] |
Y. Kato, H. Onischi, Y.K. Machida. Curr. Pharm. Biotechn. 4(5), 303-309 (2003). |
|
[4] |
W. Marit, K.M. Varum, A.M. Hermansson, O. Smidsrod, D.A. Brant. Carbohydr. Polym. 25(1), 13-23 (1994) |
Acknowledgements
The authors express their thanks to Heppe Medical Chitosan GmbH that kindly donated the chitosans and to thank Wyatt Technology Europe and especially Dr. Roessner for the helpful discussions.


